Customer Efficiency Report
Table of Contents
The “Ticket Efficiency by Customer Report” is one of two Syncro reports designed to expose the strengths and weaknesses in your business' efficiency.
You can use this report to understand which of your customers:
- Require additional training on new technologies
- Have an abundance of aging technology with no third-party support available, causing an inordinate amount of support tickets
- Consistently consume inordinate amounts of support on overly simple things
- Have needs that are far more complex than the average customer. This can be help you in the contract renewal process, especially when the customer consumes far more resources than originally anticipated.
Generate the Report
To generate this report, follow these steps:
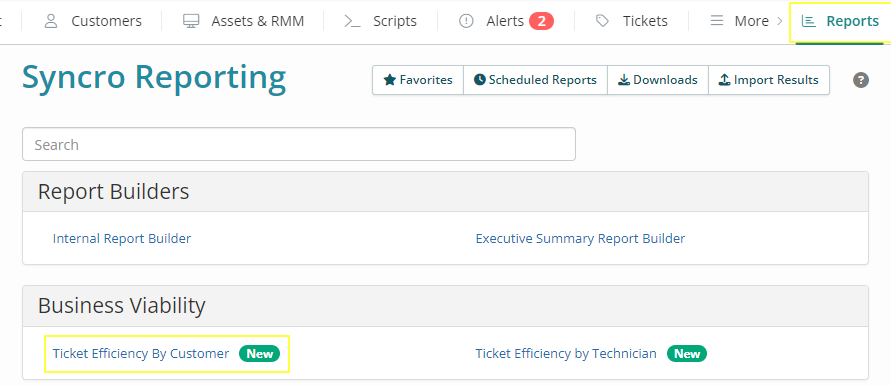
- Navigate to Reports. (If you don't see it, click More > to display more tabs.)
- In the Business Viability section, click “Ticket Efficiency by Customer Report”:

Syncro displays the Ticket Efficiency By Customer Report builder options:
- Use the Period dropdown menu to select the timeframe to include in the report. “Last Quarter” is the default, but you can select from: “Today,” “Yesterday,” “This Week/Month/Quarter/Year,” “Month/Last Month to Date,” “Last Week/Month/Quarter,” “Since 30/60/90/365 days ago.”
Or, select “Custom” and provide your own From/To Dates using the calendar fields that appear:
Note: The lookback period is limited to one year to optimize performance. - Use the Ticket Type dropdown menu of checkboxes to select any Ticket (Issue) Type(s) you want to include in your report. You define ticket Issue Types in Ticket Settings.
- Use the Sort By dropdown to select how you'd like the report to be ordered:
- Customer: The default; Syncro sorts report data alphabetically by customer.
- Least/Most Average Time Per Ticket: Syncro sorts report data by each customer's total average open ticket time compared to the total Company Average time per ticket.
- Least/Most Efficient: Syncro sorts report data sorted by each customer's total efficiency percentage. See About Resource Efficiency.
- Least/Most Total Time Spent: Syncro sorts report data by the total open ticket time compared to the total Company open ticket time. See About Total Time Spent.
- Click Run Report. (Depending on the quantity of data, Syncro might take a minute to display results.)
Tip: When you get the report to the state you want, click Save Favorite. Then you can get it back with a single click from the main Reports page. See also About the Reports Tab/Page.
Interpret the Report
The first section Syncro displays when you run the Customer Efficiency Report is Company Averages:

This represents your baseline for the selected period. Throughout the report, each of your customer's data will be compared to it.
Syncro displays Company Averages from all resolved tickets during the selected time period alphabetically by:
- Ticket (Issue) Type for Ticket Count,
- Average Time Per Ticket, and
- Total Time Spent.
Time columns reflect actual time-on-ticket recorded via the Ticket Timer in the ticket's Labor Log section. (So it's important to have your techs track ticket time accurately!) Totals for each column display in bold.
Tip: To easily view all tickets considered during the selected time frame, click the hyperlinked number in the Ticket Count column. Syncro will display the Tickets tab/page with appropriate filters in place.
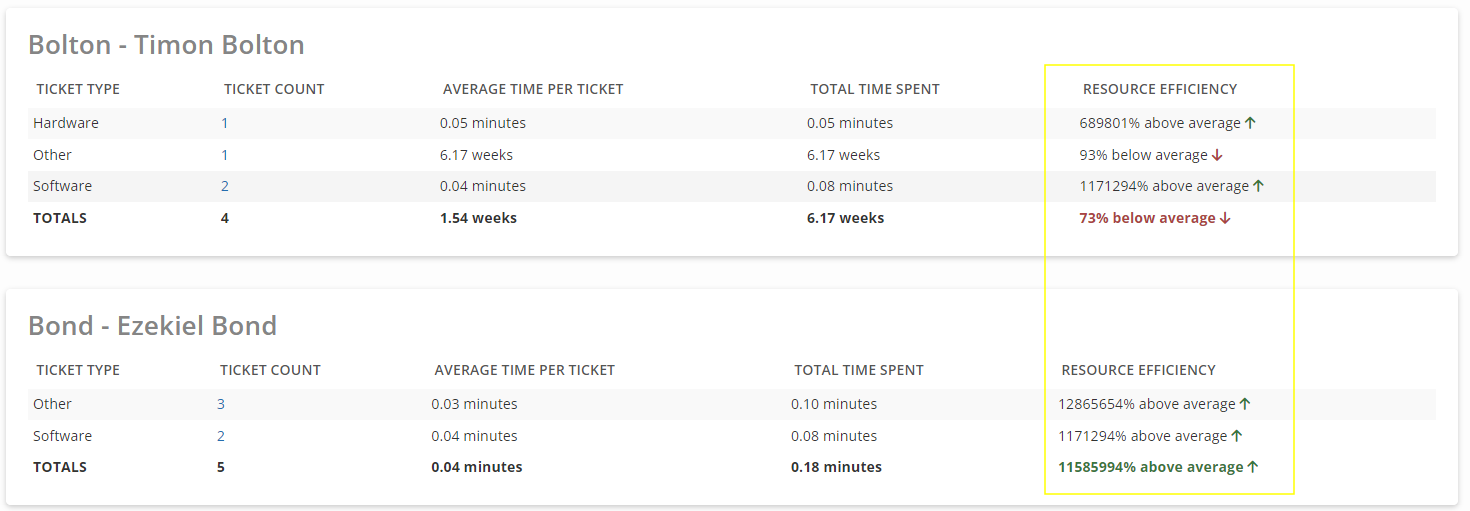
In subsequent sections, you'll see sections for each Customer's data, ordered by your Sort By selection:

In each section you'll see an additional Resource Efficiency column at the far right. See About Resource Efficiency.
Note: To optimize performance, tickets marked “Resolved” may take up to an hour before being reflected in ticket efficiency reporting.
The data in this column displays with a red/down or green/up arrow, helping you easily see where this customer stands in relation to your Company Average.
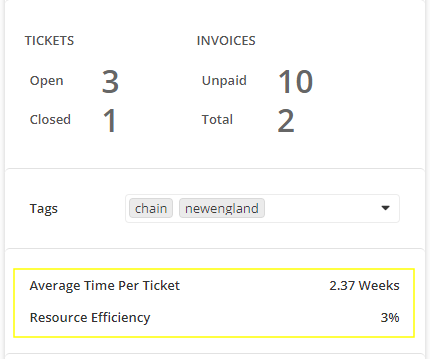
Tip: You can also find efficiency values per (Customer) Organization on their Details page:

About Resource Efficiency
Syncro creates a company baseline using every single resolved ticket within the selected period. This is then compared against each individual customer to determine which customers are more or less efficient than your average.
In other words, this report showcases which customers are consuming more of your resources than your company average, and which are consuming less.
This is then broken down more granularly by ticket type, allowing you to see if particular type(s) of work are triggering these exceptions.
About Total Time Spent
Syncro calculates the Total Time Spent by taking the total amount of time between when a ticket is first opened until it’s marked with a “Resolved” status. See also How Ticket Statuses Change.
Pause Time Spent on Tickets With Specific Statuses
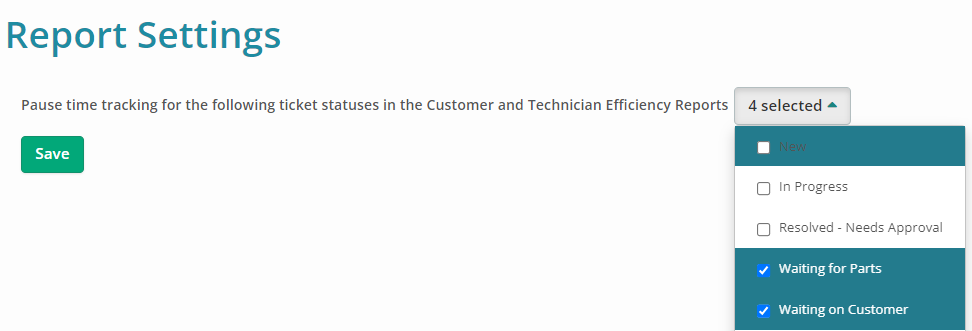
If there are specific ticket statuses—such as “Waiting on Customer"—that you don't want to count toward the “Total Time Spent” metric, you can pause time tracking for them.
To do this, follow these steps:
- Navigate to Admin > Reports - Preferences. Syncro displays the Report Settings page:

- Use the dropdown menu to select any Ticket Statuses you want to exclude from this report.
- Click Save.
